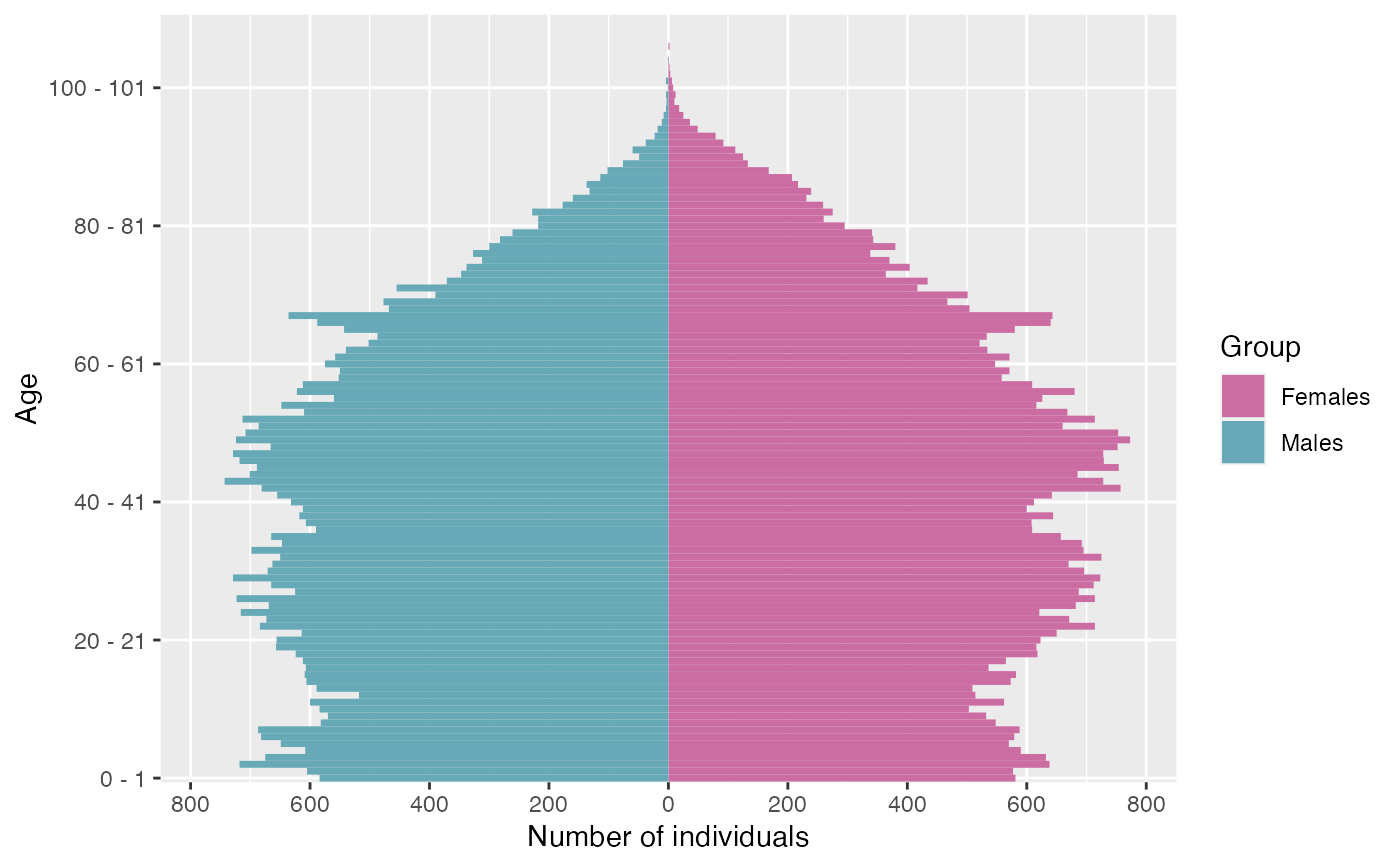
Plot the age pyramid of a population data frame (at a given time).
Source:R/pyramid.R
plot.population.RdPlot an age pyramid from age pyramid data frame with possibly several characteristics.
# S3 method for class 'population'
plot(
  x,
  group_colors = NULL,
  group_legend = "Group",
  age_breaks = NULL,
  value_breaks = NULL,
  ...
)
Arguments
- x
Object of class population.
- group_colors
(Optional) Named character vector.
- group_legend
(Optional) Legend title name. By default set to
"Group".- age_breaks
(Optional) An ordered vector of indexes of vector
unique(pyr$age)used for breaks for the axis of ages.- value_breaks
(Optional) Breaks for the axis of values.
- ...
Additional arguments
Value
Plot of age pyramid.
See also
Examples
plot(population(EW_pop_14$sample), time = 0)